IT teams rarely lack operational data. The challenge is turning millions of logs, alerts and events into a clear understanding of what is happening, why it is happening and what to do next.
Logmind v3 shortens that path. The new release connects data preparation, operational visibility, issue investigation, AI-assisted troubleshooting and visualization in one operational workflow. Teams can identify important changes, understand their impact, inspect the underlying evidence and act, all without losing context as they move between tasks.
The release introduces includes a redesigned Operations Overview, a more detailed Insights experience, improved Discovery and Dashboards, our AI assistant Modu, and new visual data-processing pipelines.
What’s new in Logmind v3
- Redesigned Overview: Get a quick view of what’s happening across your environment and spot issues that need attention.
- More detailed Insights: See anomalies, affected services, related events, dependencies and other useful context together.
- Modu, our AI assistant: Ask questions in natural language and get explanations and guidance based on your operational data.
- Imporved Discovery: Search individual events, uncover recurring patterns and dig into the details when needed.
- Updated Dashboards: Build clear views of the activity and trends that matter to your team.
- Visual processing pipelines: Build, test and manage how incoming data is processed before it is analysed.
Together, these capabilities create a more direct path from the first sign of an issue to an informed response.
See what matters from the start
The redesigned Overview gives teams an immediate view of activity across their environment.
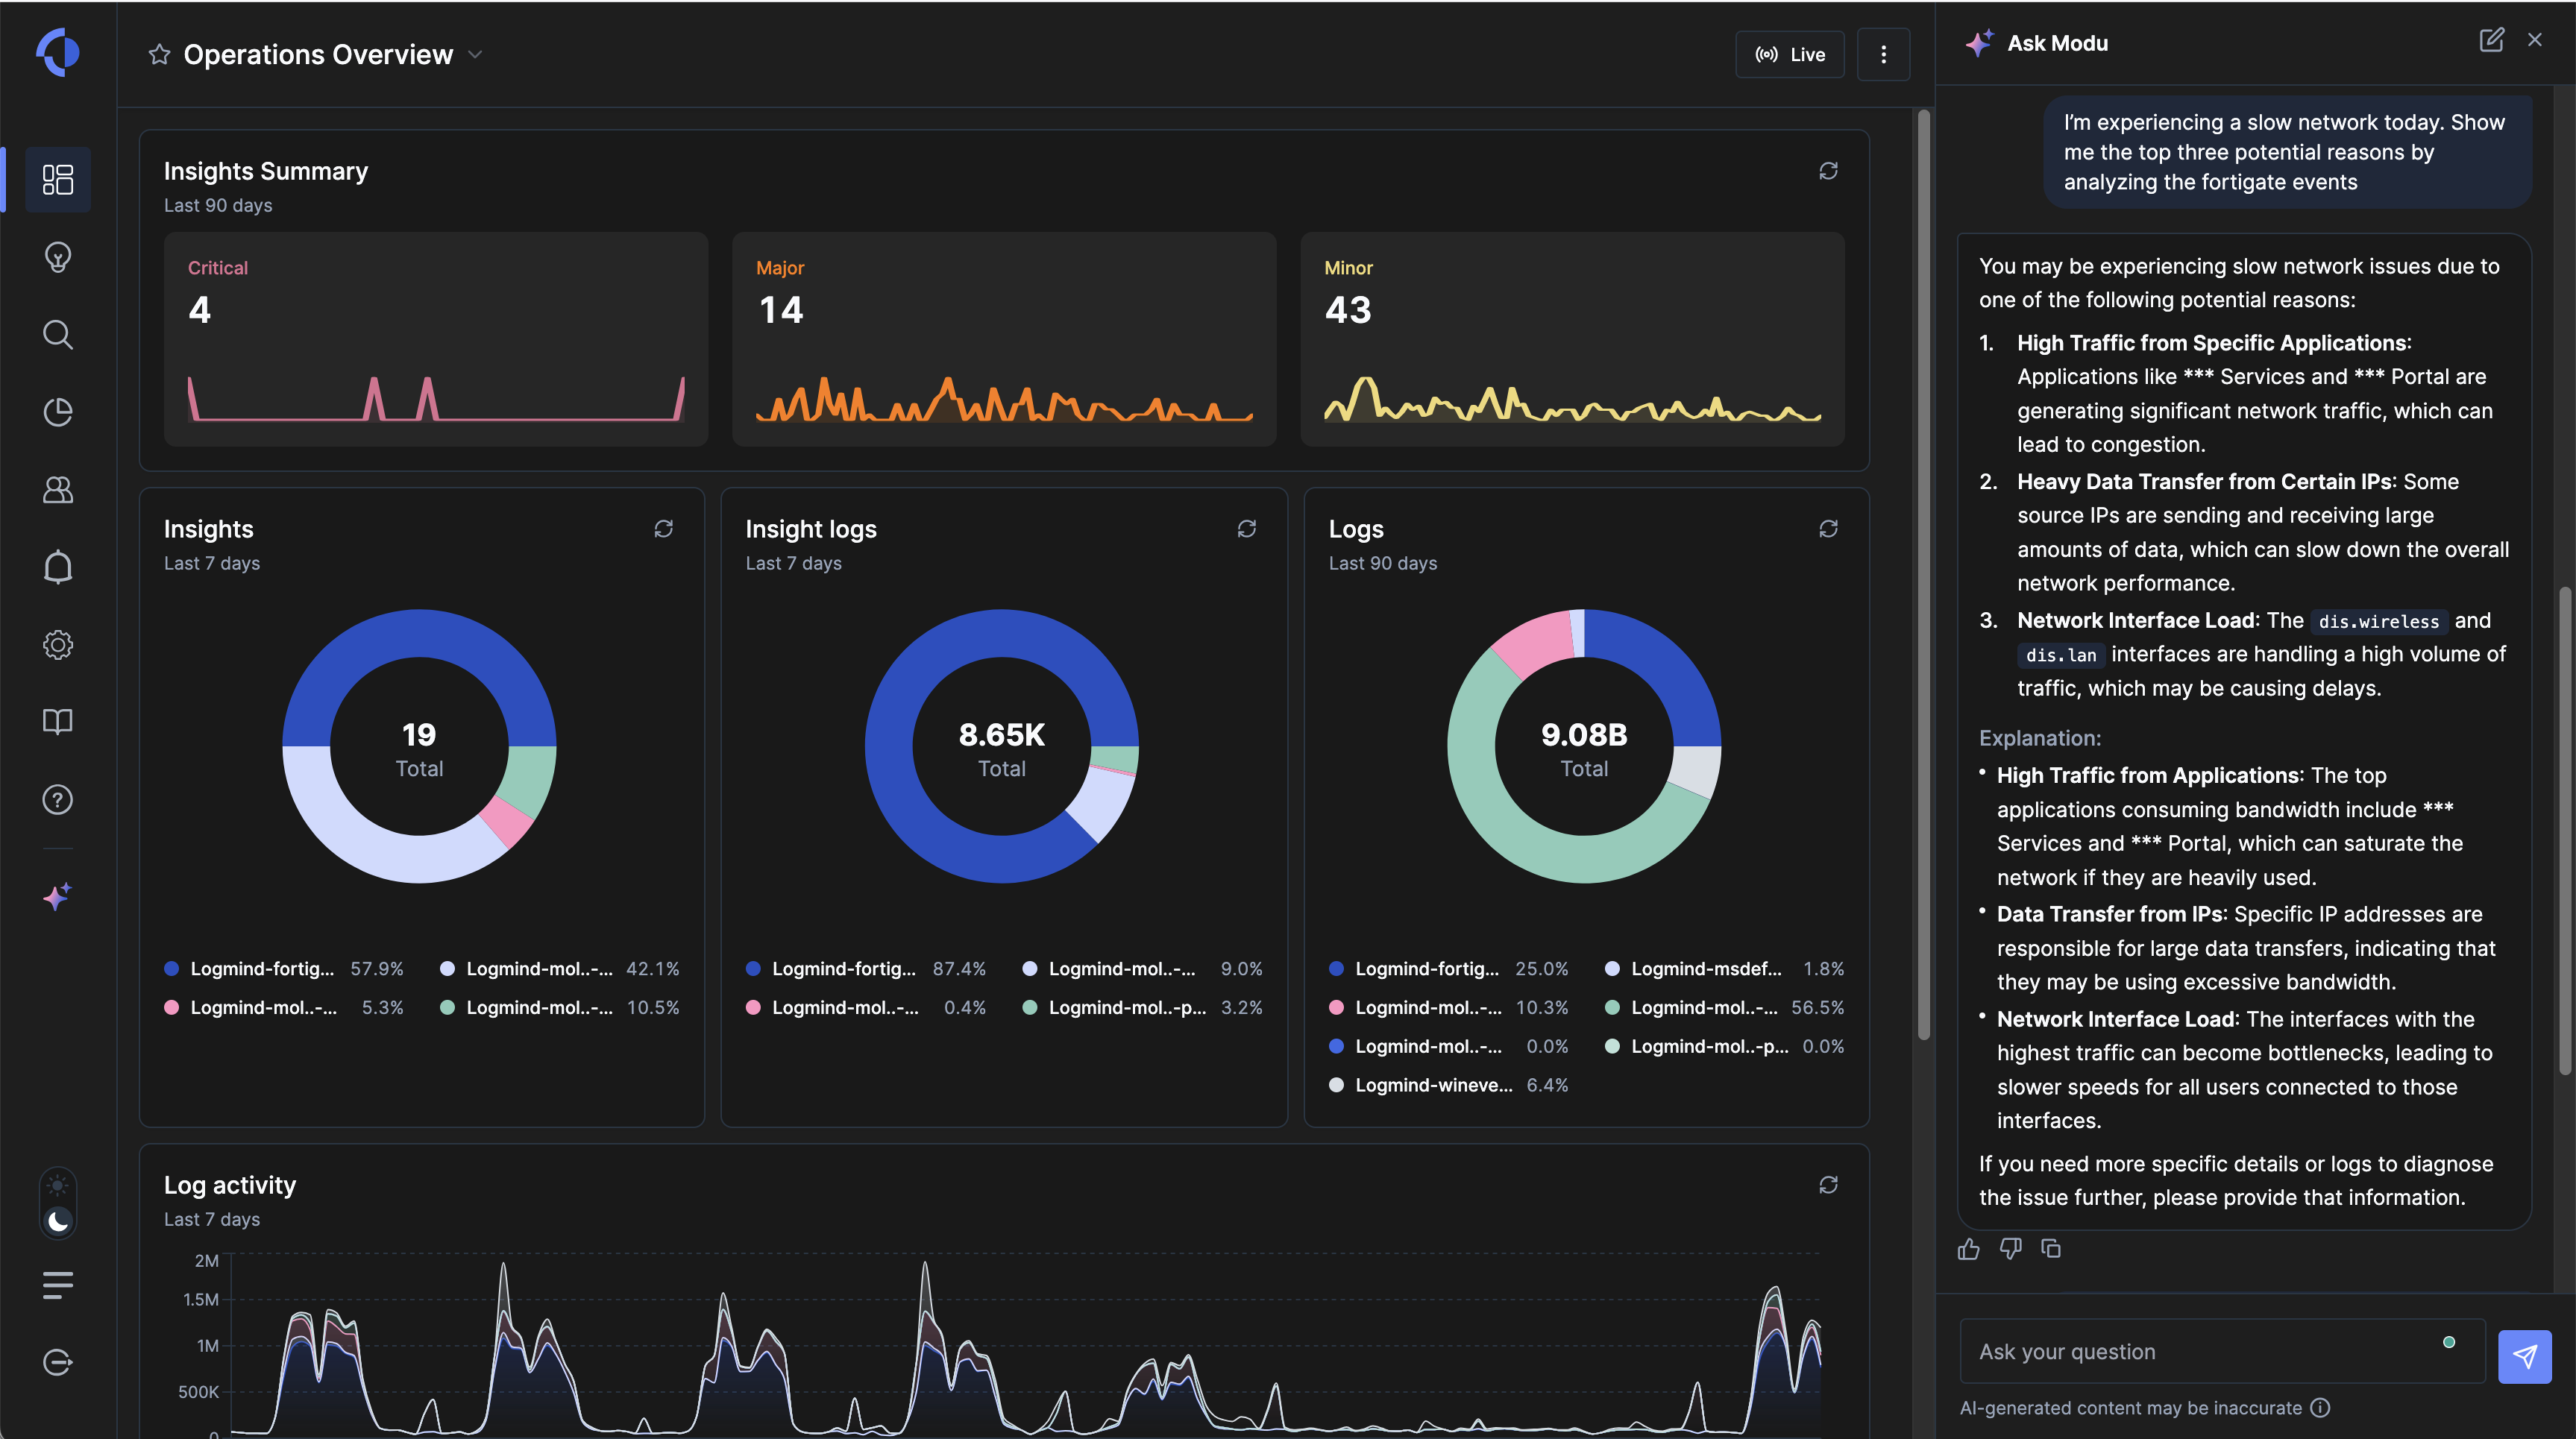
It includes several views, including the new Operations Overview, which brings together critical, major, and minor Insights alongside recent trends, data-source activity, log volumes, and changes in system behavior. Teams can quickly see where error volumes are increasing, whether a data source has stopped reporting, and which issues need attention - without opening separate dashboards or building queries first.
From the same workspace, users can move from a high-level view of system health into a more detailed investigation while keeping the relevant time range and operational context.
Modu is available directly in the Overview, just as it is across other Logmind modules. This allows users to ask questions about what they are seeing and explore their operational data without interrupting their workflow.
Ask questions with Modu, the Logmind AI assistant
Modu is the AI assistant built into Logmind v3. It helps users interpret operational information using natural language.
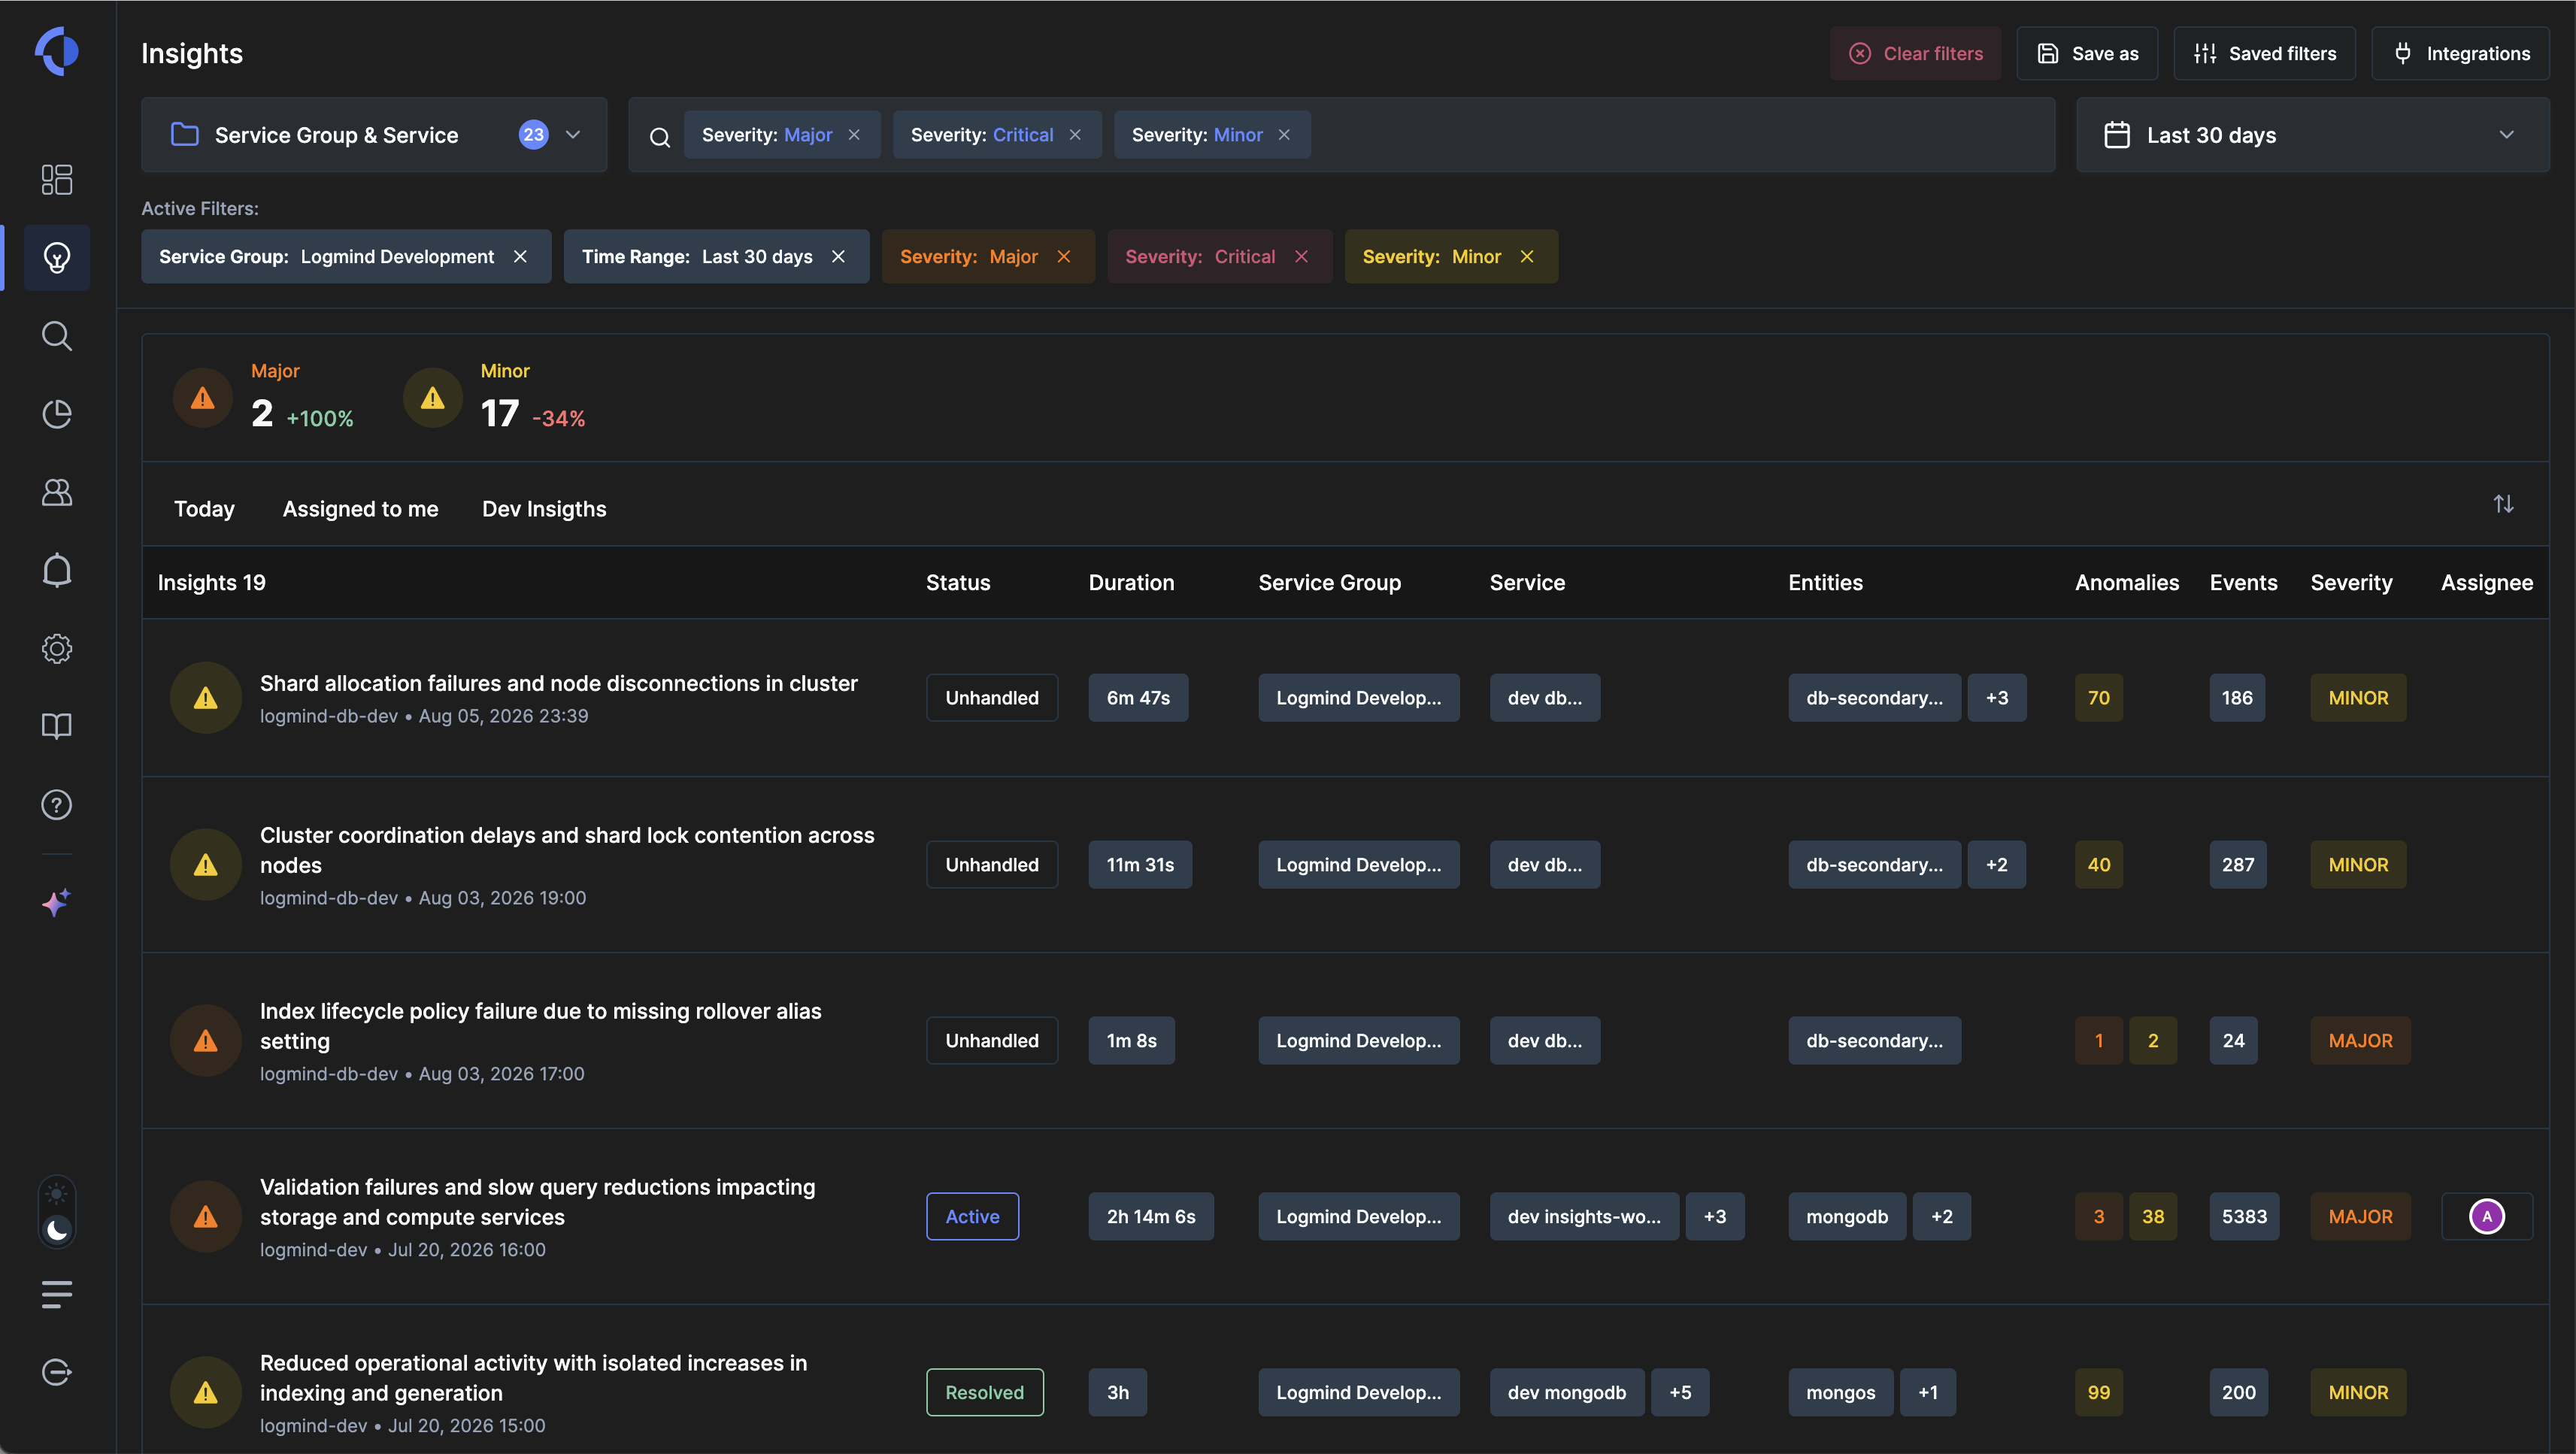
Teams can ask Modu to summarize the current state of a data source, explain unusual activity, identify potential reasons for an issue, or surface relevant details from the available service, source or entity context. Instead of starting every investigation with a manually constructed query, users can begin with the question they need answered.
For example, a user might ask:
- What changed in this service during the last hour?
- Why did authentication errors increase?
- Which data sources have stopped sending events?
- Which sources/services are showing unusual activity?
Modu is also integrated into Insights, where it can provide a likely root cause and practical troubleshooting guidance based on the related operational evidence.
Whether a user needs a quick explanation of service or source health, or support during a detailed investigation, Modu helps turn technical signals into information that is easier to understand and act upon.
Investigate issues in context
Logmind v3 introduces a more complete Insights experience for simpler investigation and resolution.
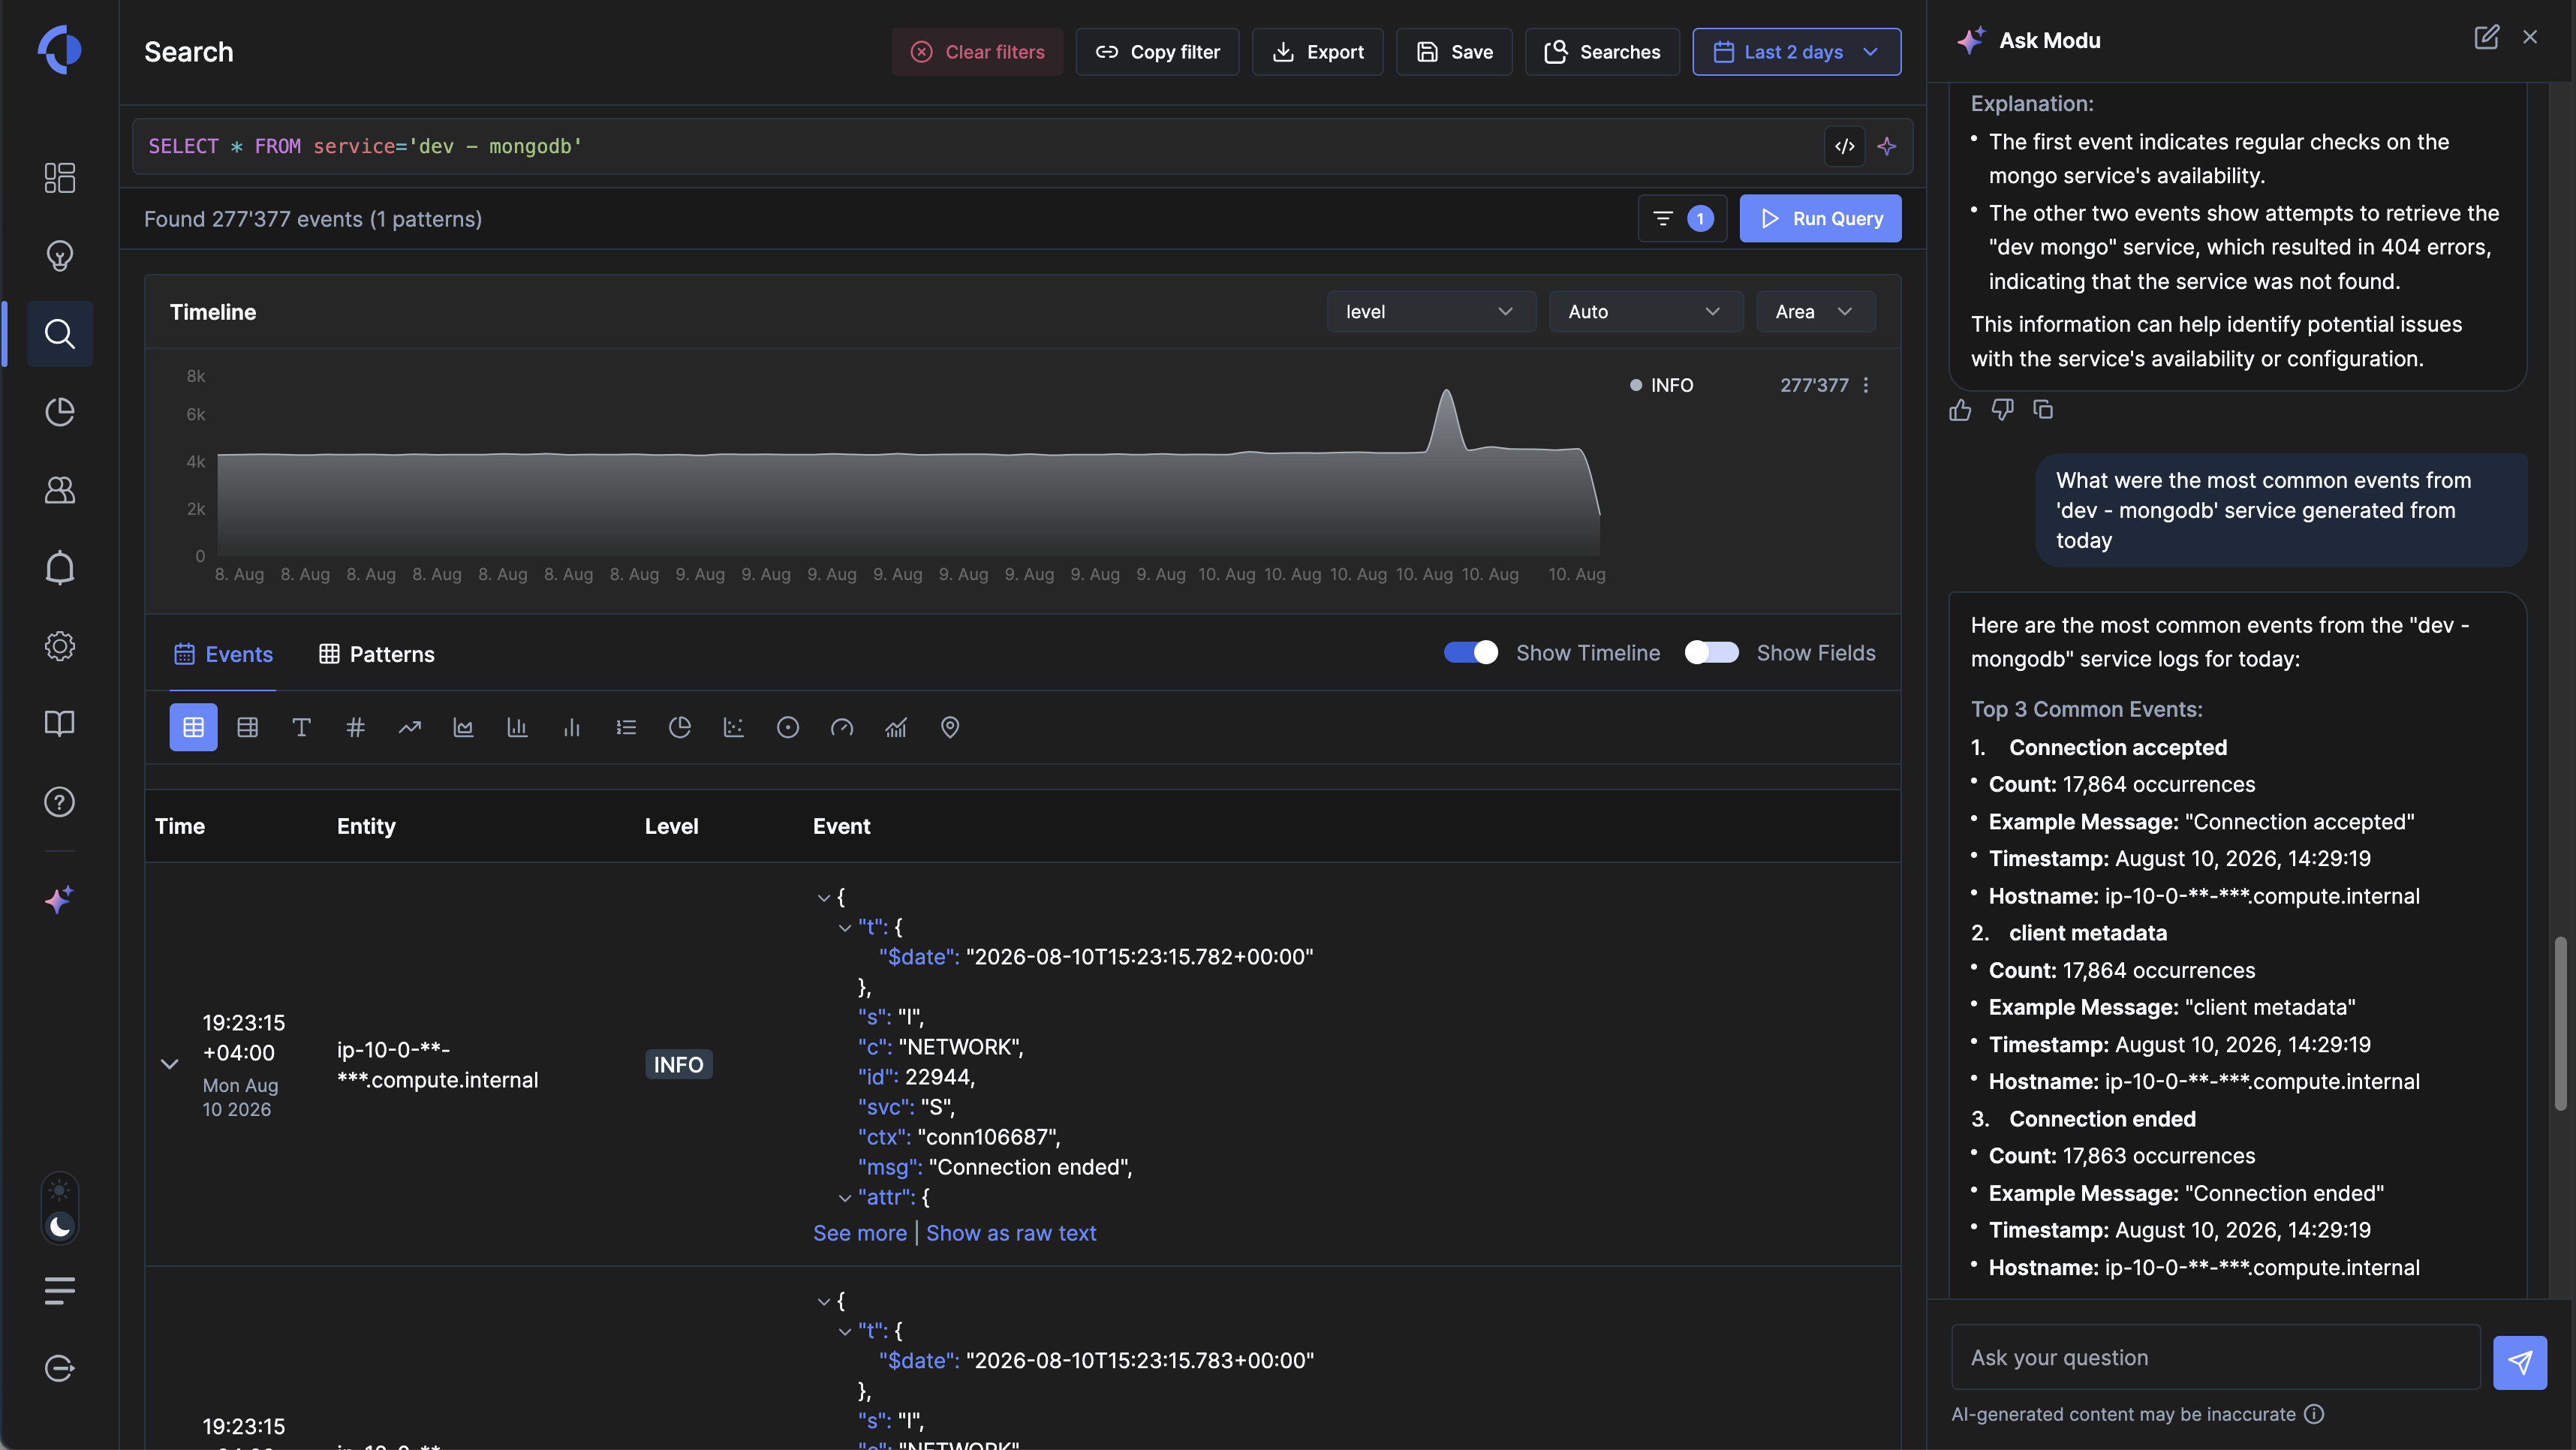
The Insights list brings together the information teams need to prioritize their work: status, duration, severity, service group, affected services, entities, anomaly counts, related events, ownership, and more. Flexible filters, saved views, time controls, and assignment options help each team focus on the Insights relevant to its responsibilities.
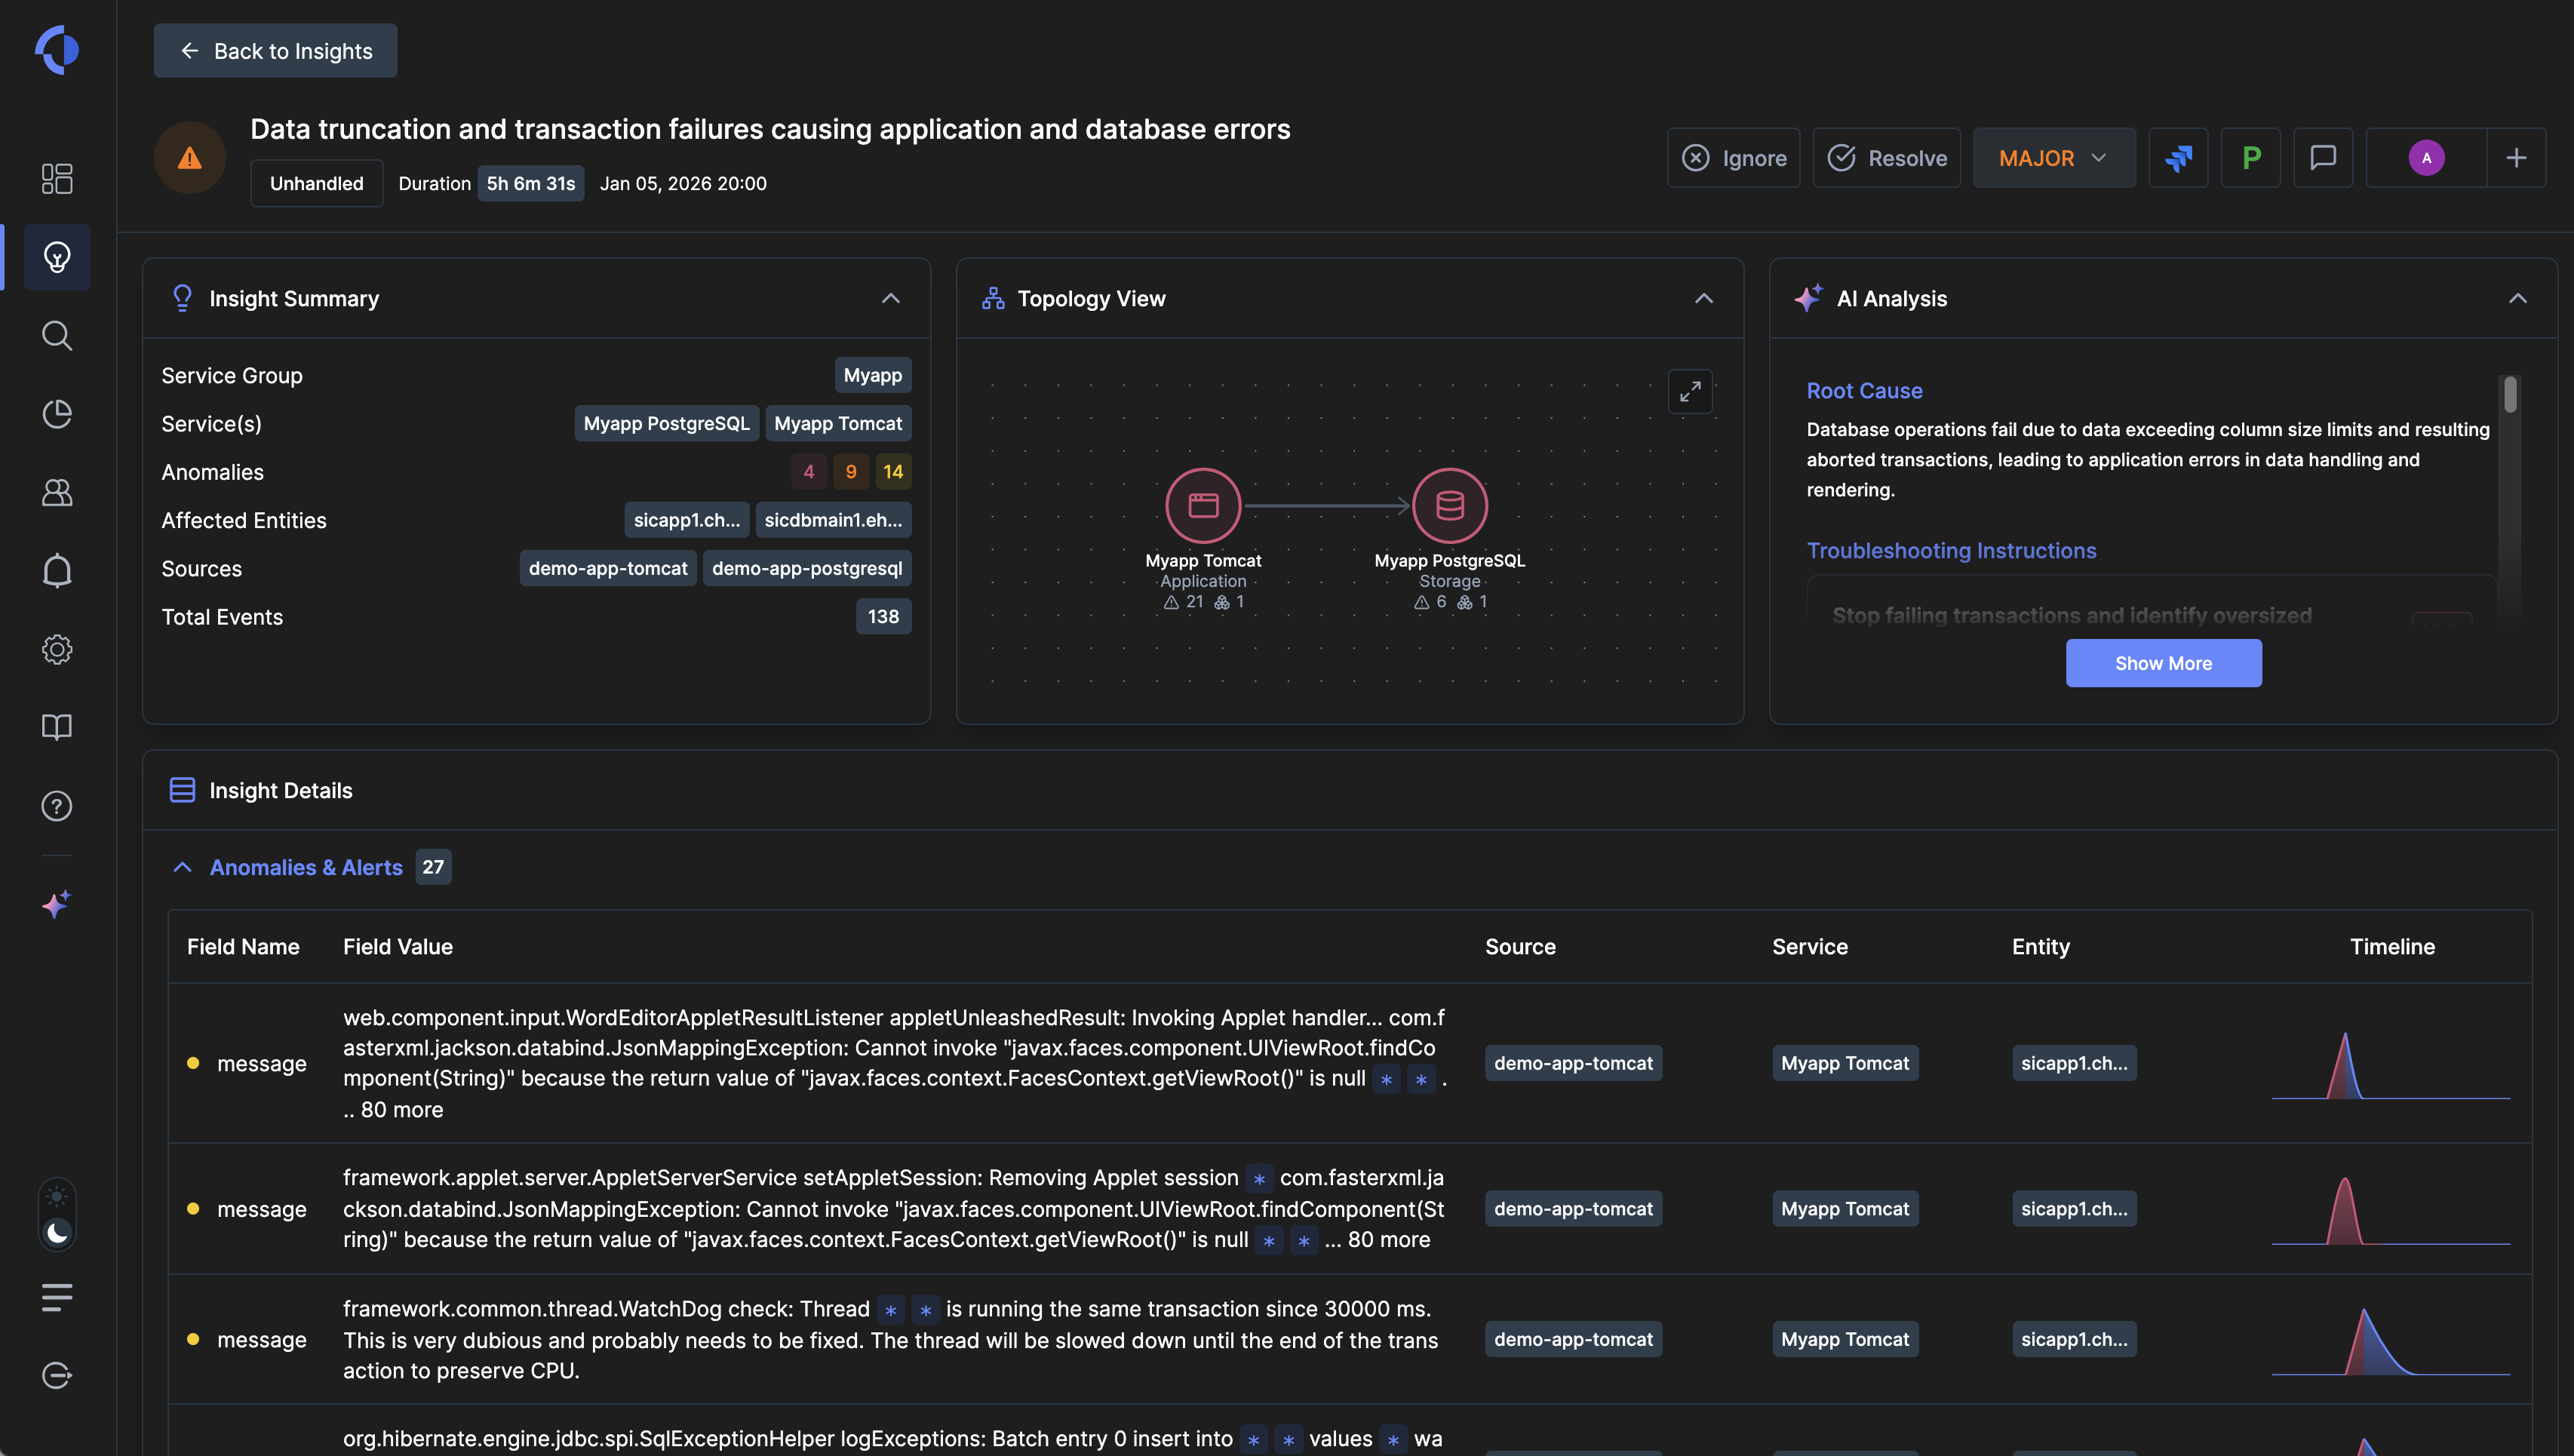
Opening an Insight brings its operational context into one place, including:
- A concise summary of the detected issue
- Affected services and entities
- Related anomalies, alerts and events
- Service dependencies in the Topology View
- AI-assisted root-cause analysis
- Troubleshooting guidance
Users can assign, comment on, ignore, or resolve an Insight from the same workspace. Analysts no longer need to move between separate alert, topology, and investigation views simply to understand an issue and coordinate the response.
Move from anomaly to action
Consider an increase in authentication failures across several connected services.
The Operations Overview surfaces the change and shows its severity. Opening the corresponding Insight reveals which services and entities are affected, the anomalies detected around the same time, and the sequence in which the activity developed.
The Topology View shows the relevant service dependencies, while Modu summarizes the available evidence and suggests a likely cause. An operator can then inspect the underlying events, assign the Insight to the appropriate owner, document the investigation, and track it through resolution.
What begins as a change among thousands or millions of events becomes a focused investigation with the relevant signals, context, and actions connected in one workflow.
Explore the underlying data
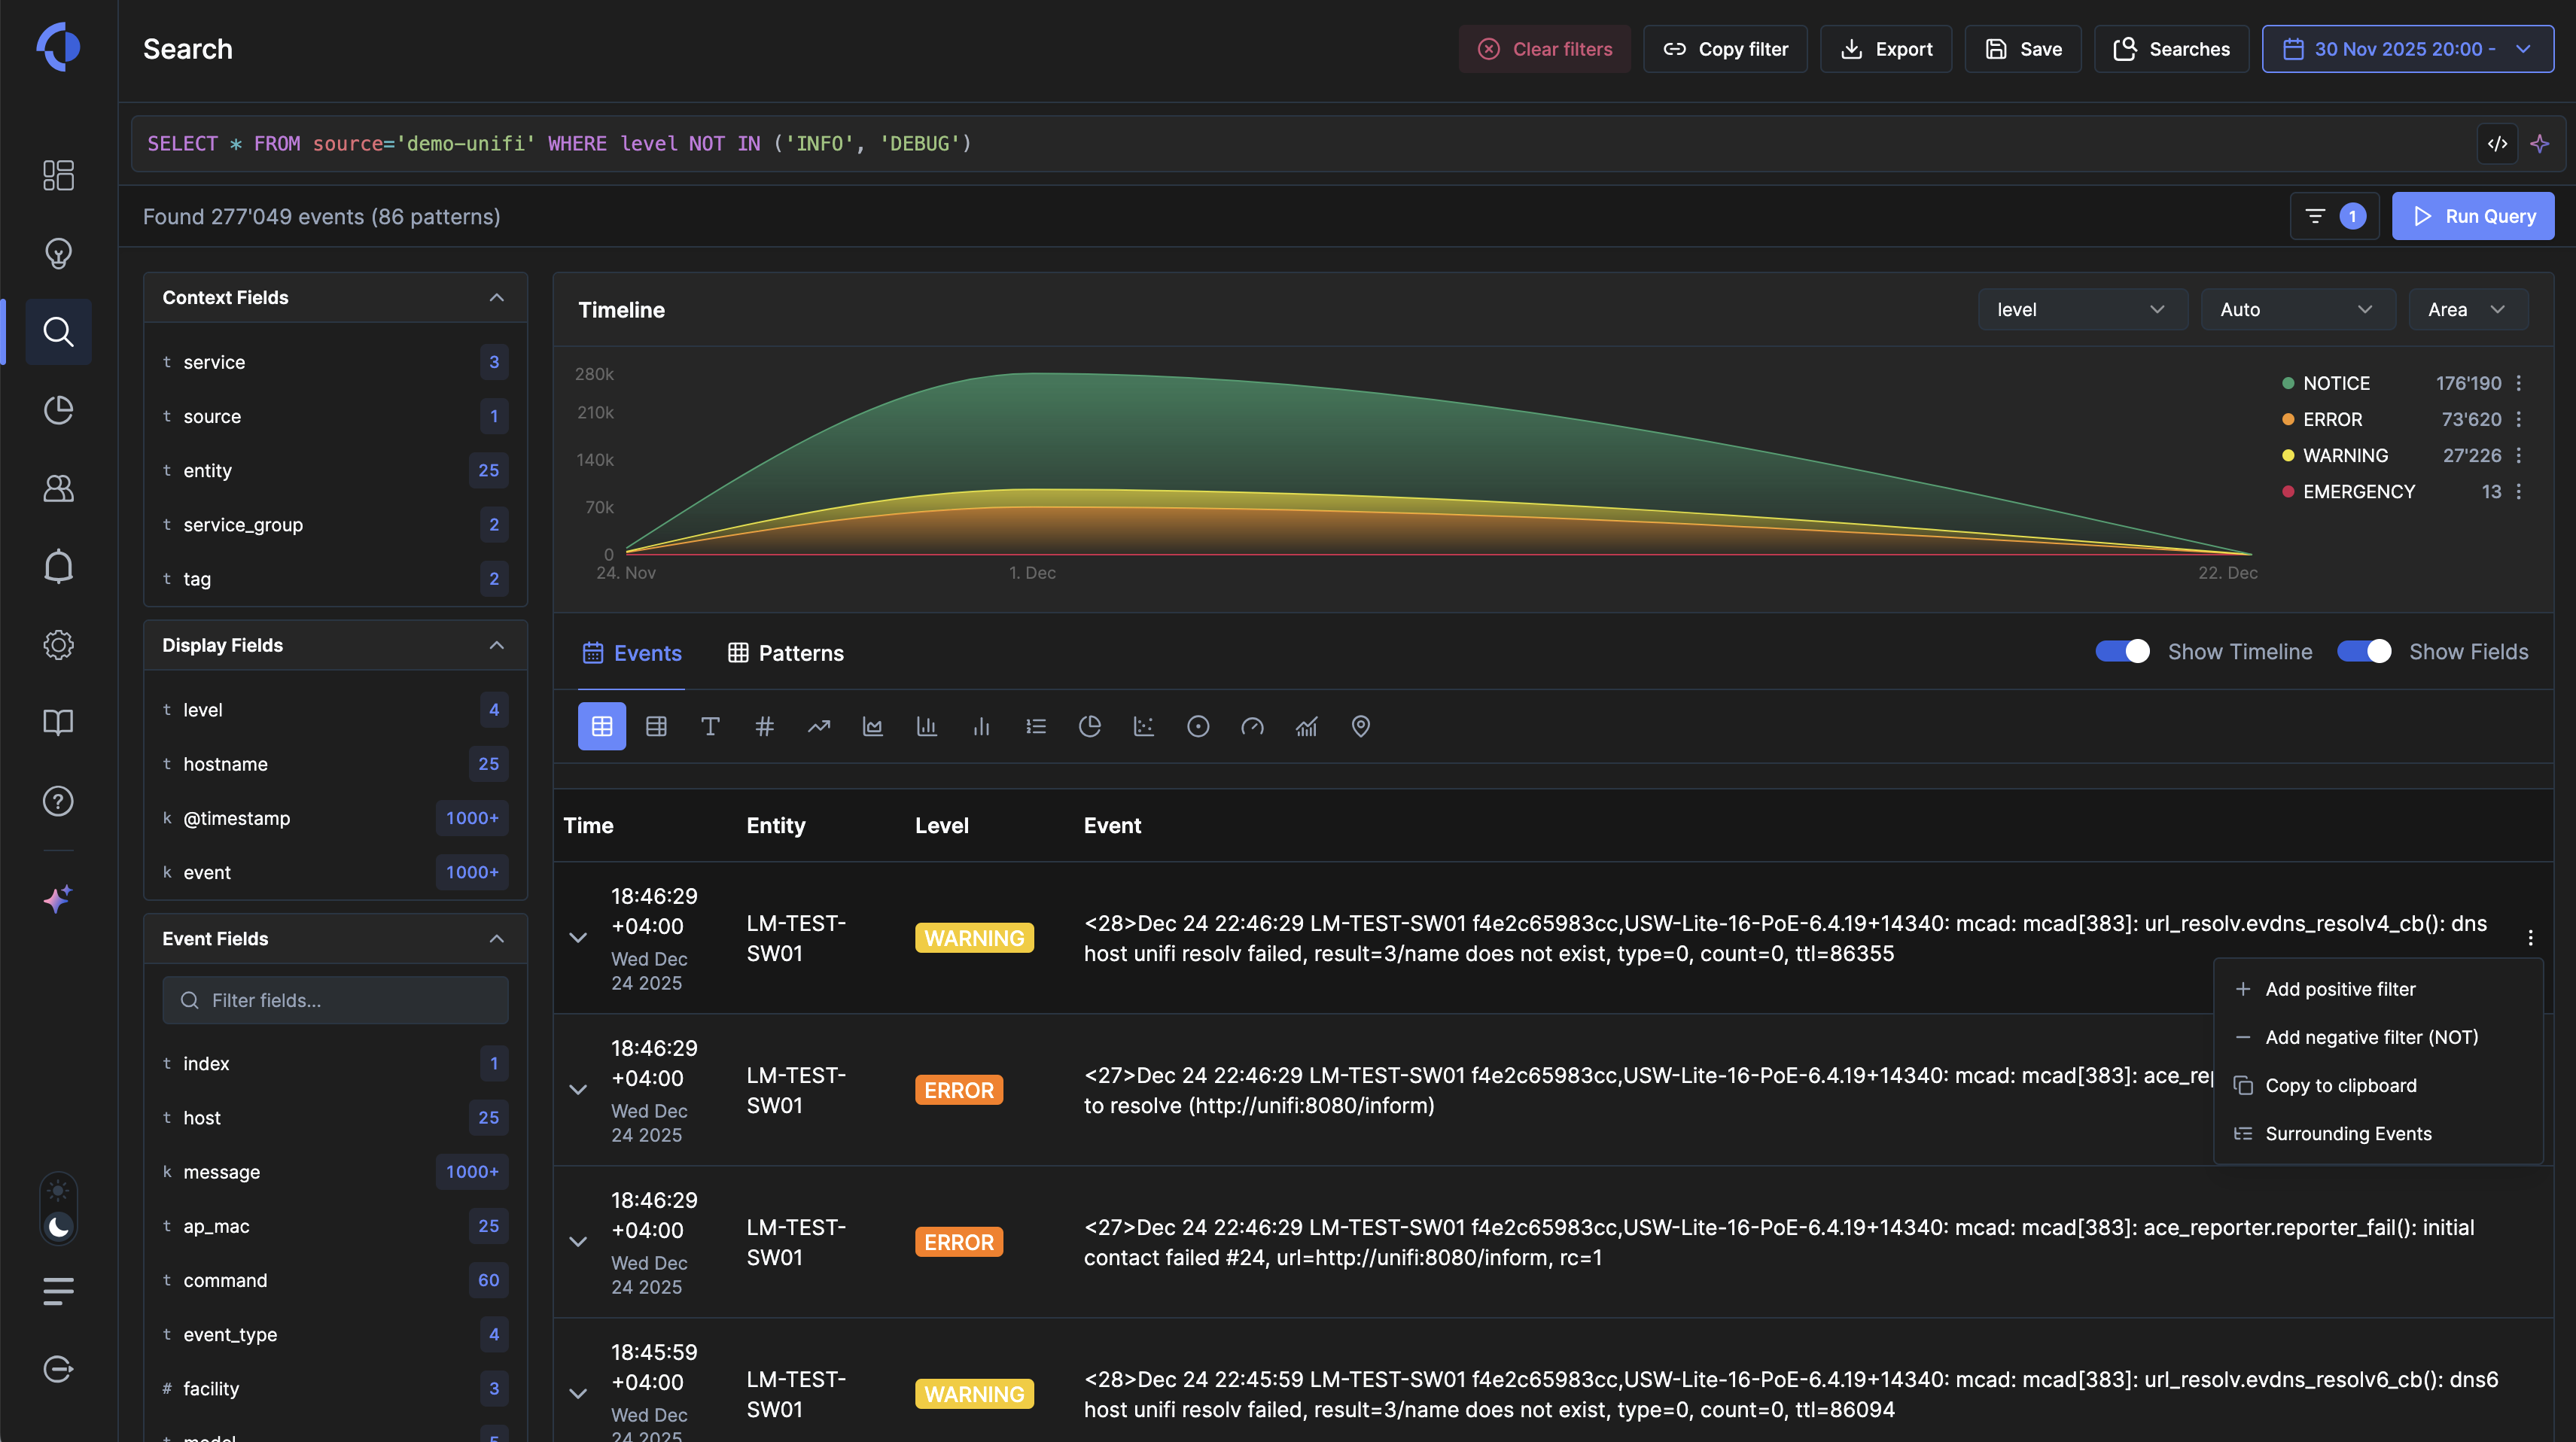
When teams need to go deeper, the updated Discovery experience provides flexible tools for investigating events and patterns across large volumes of operational data.
Users can build precise queries, apply positive or negative filters, select relevant fields, inspect surrounding events, and compare activity across time periods. Results can be viewed as individual events or grouped patterns, allowing analysts to move between broader trends and the evidence behind them.
Queries and filters can be saved, copied, or exported for repeated investigations and collaboration. This helps teams preserve useful investigative work instead of recreating it when a similar issue occurs.
Turn complex activity into clear visualizations
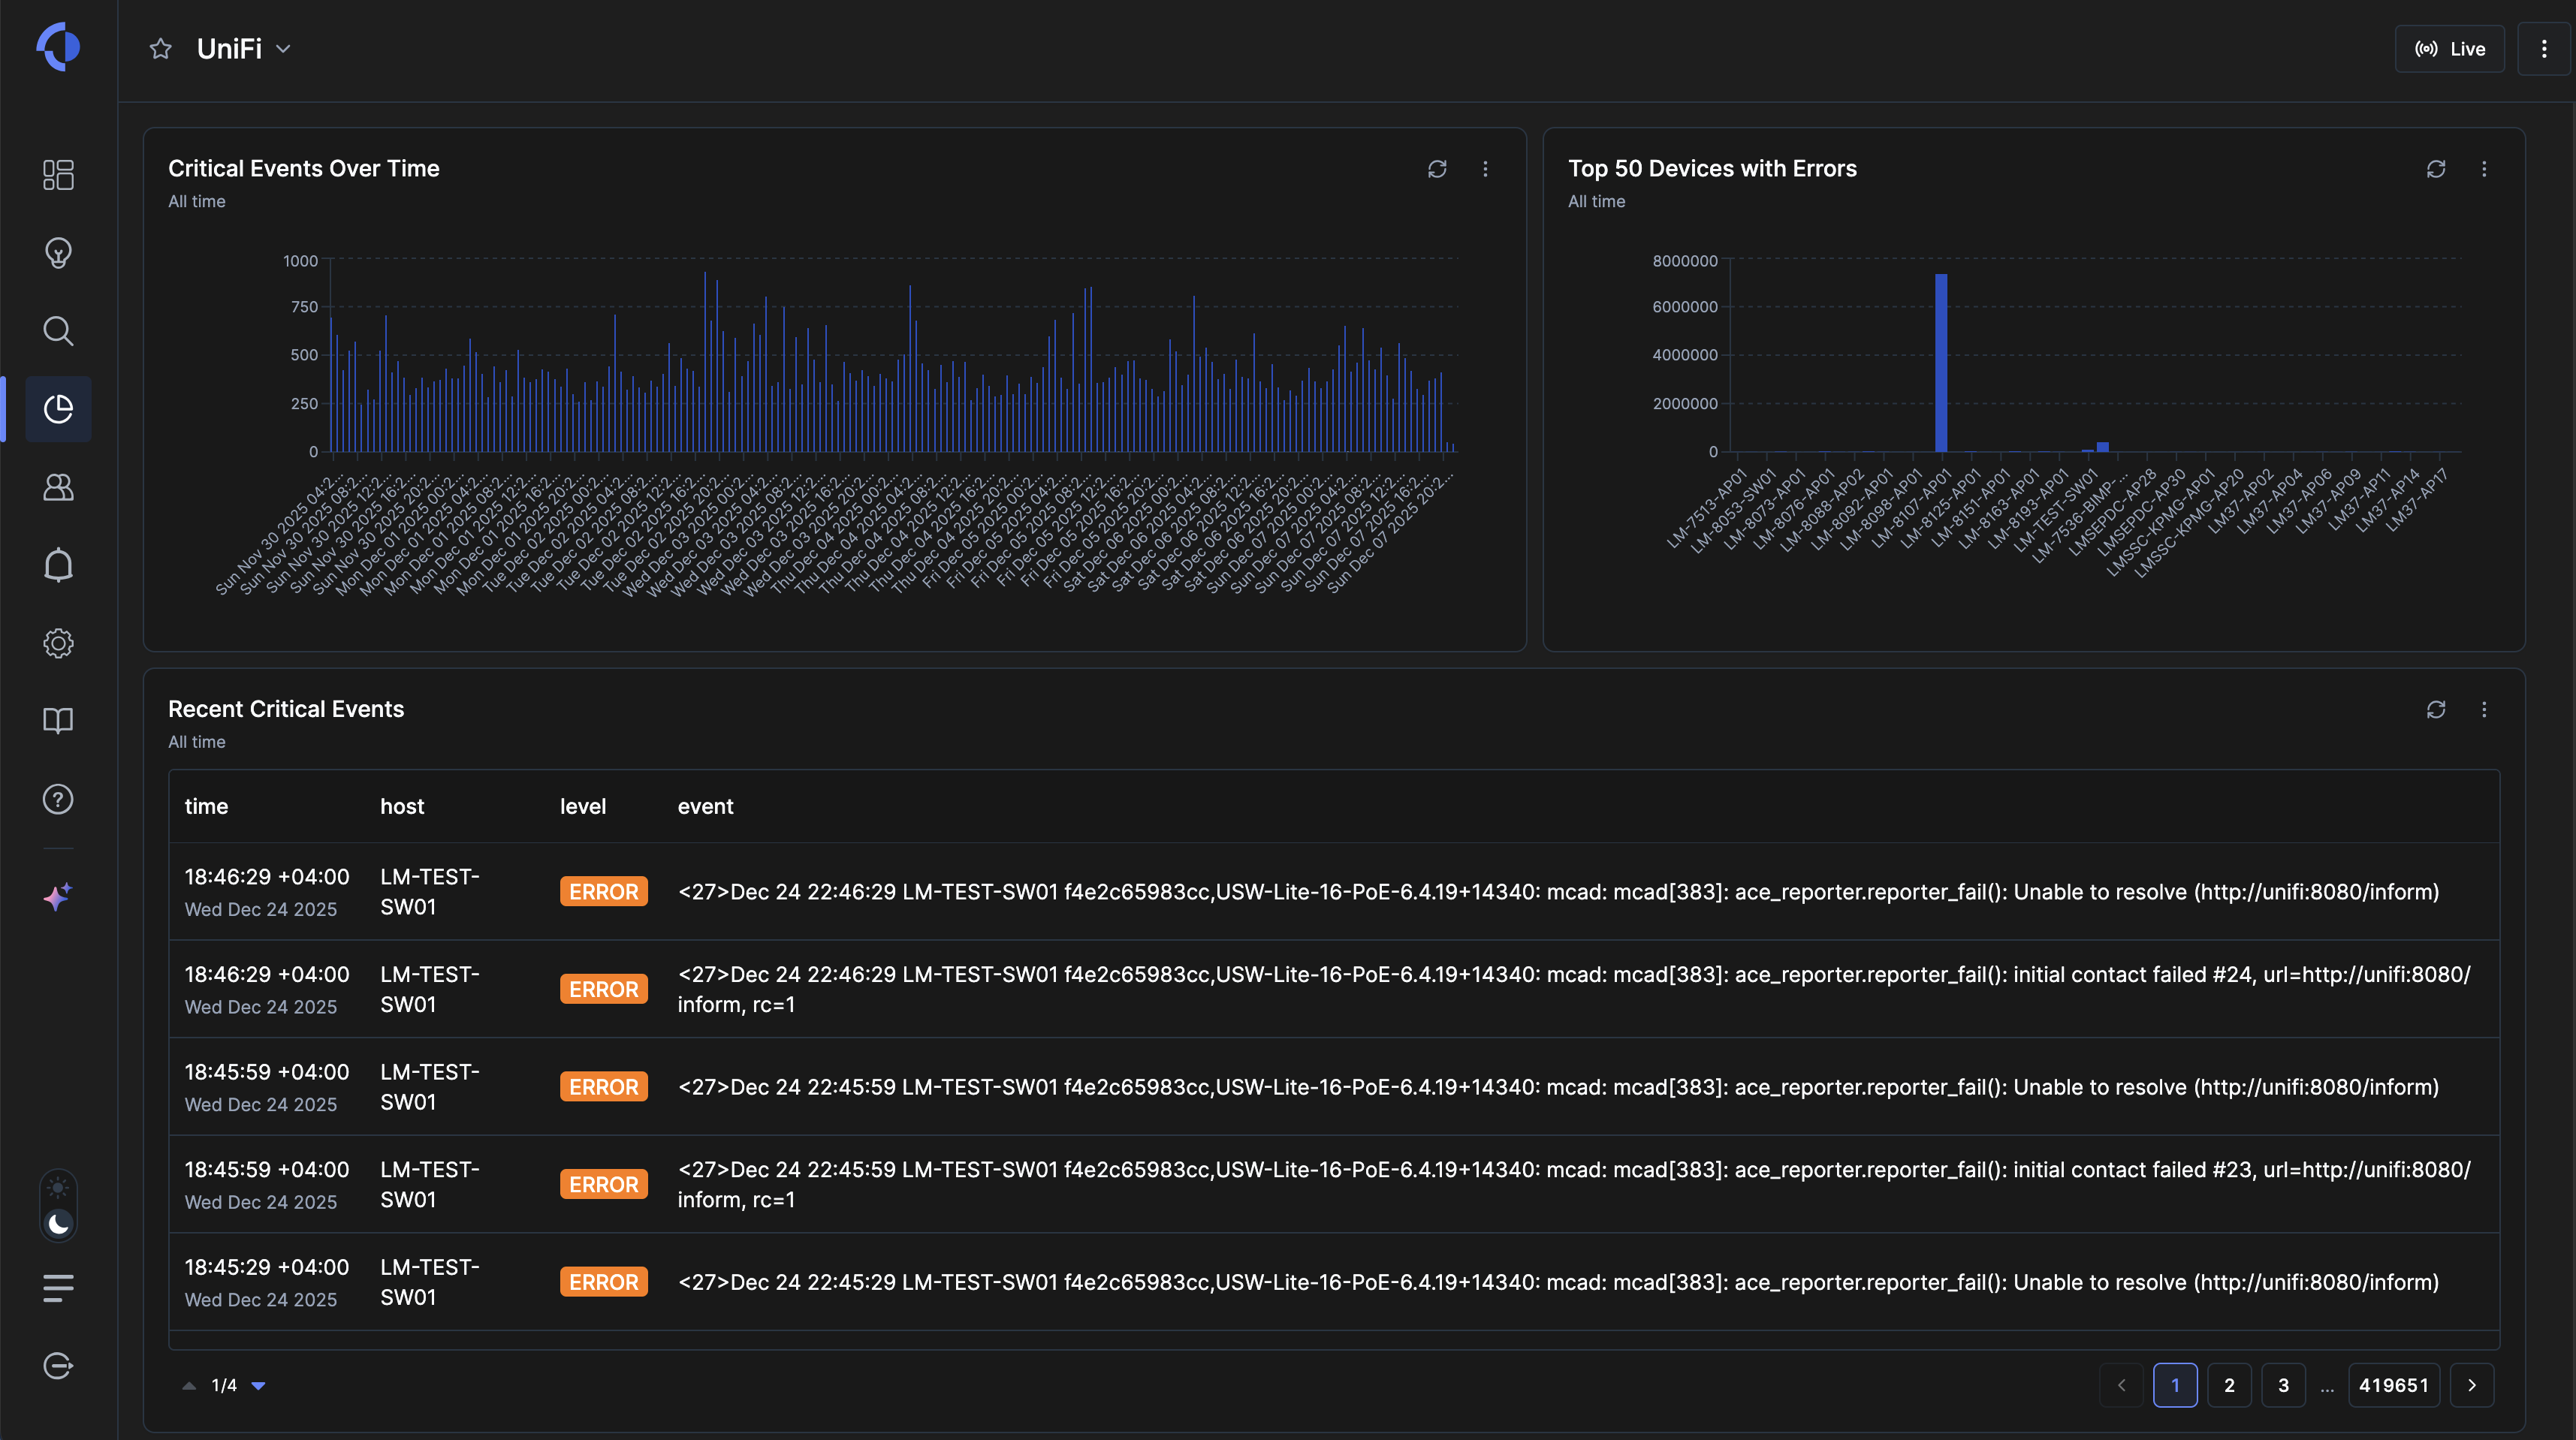
The updated dashboard experience helps teams recognize patterns across services, sources, users, devices, event types, and error categories.
Teams can combine charts, trends, distributions, and detailed event tables to create views suited to their systems and responsibilities. The underlying events remain available for investigation, so a visualization is not the end of the analysis—it is an entry point into the relevant data.
Dashboards can help answer practical operational questions such as:
- Which services or devices are generating the most errors?
- Where is critical activity increasing?
- Which users or entities are affected?
- Is an issue isolated or visible across connected components?
- How is system behavior changing over time?
This gives teams a faster way to identify significant changes while retaining access to the evidence needed to understand them.
Build and validate processing pipelines visually
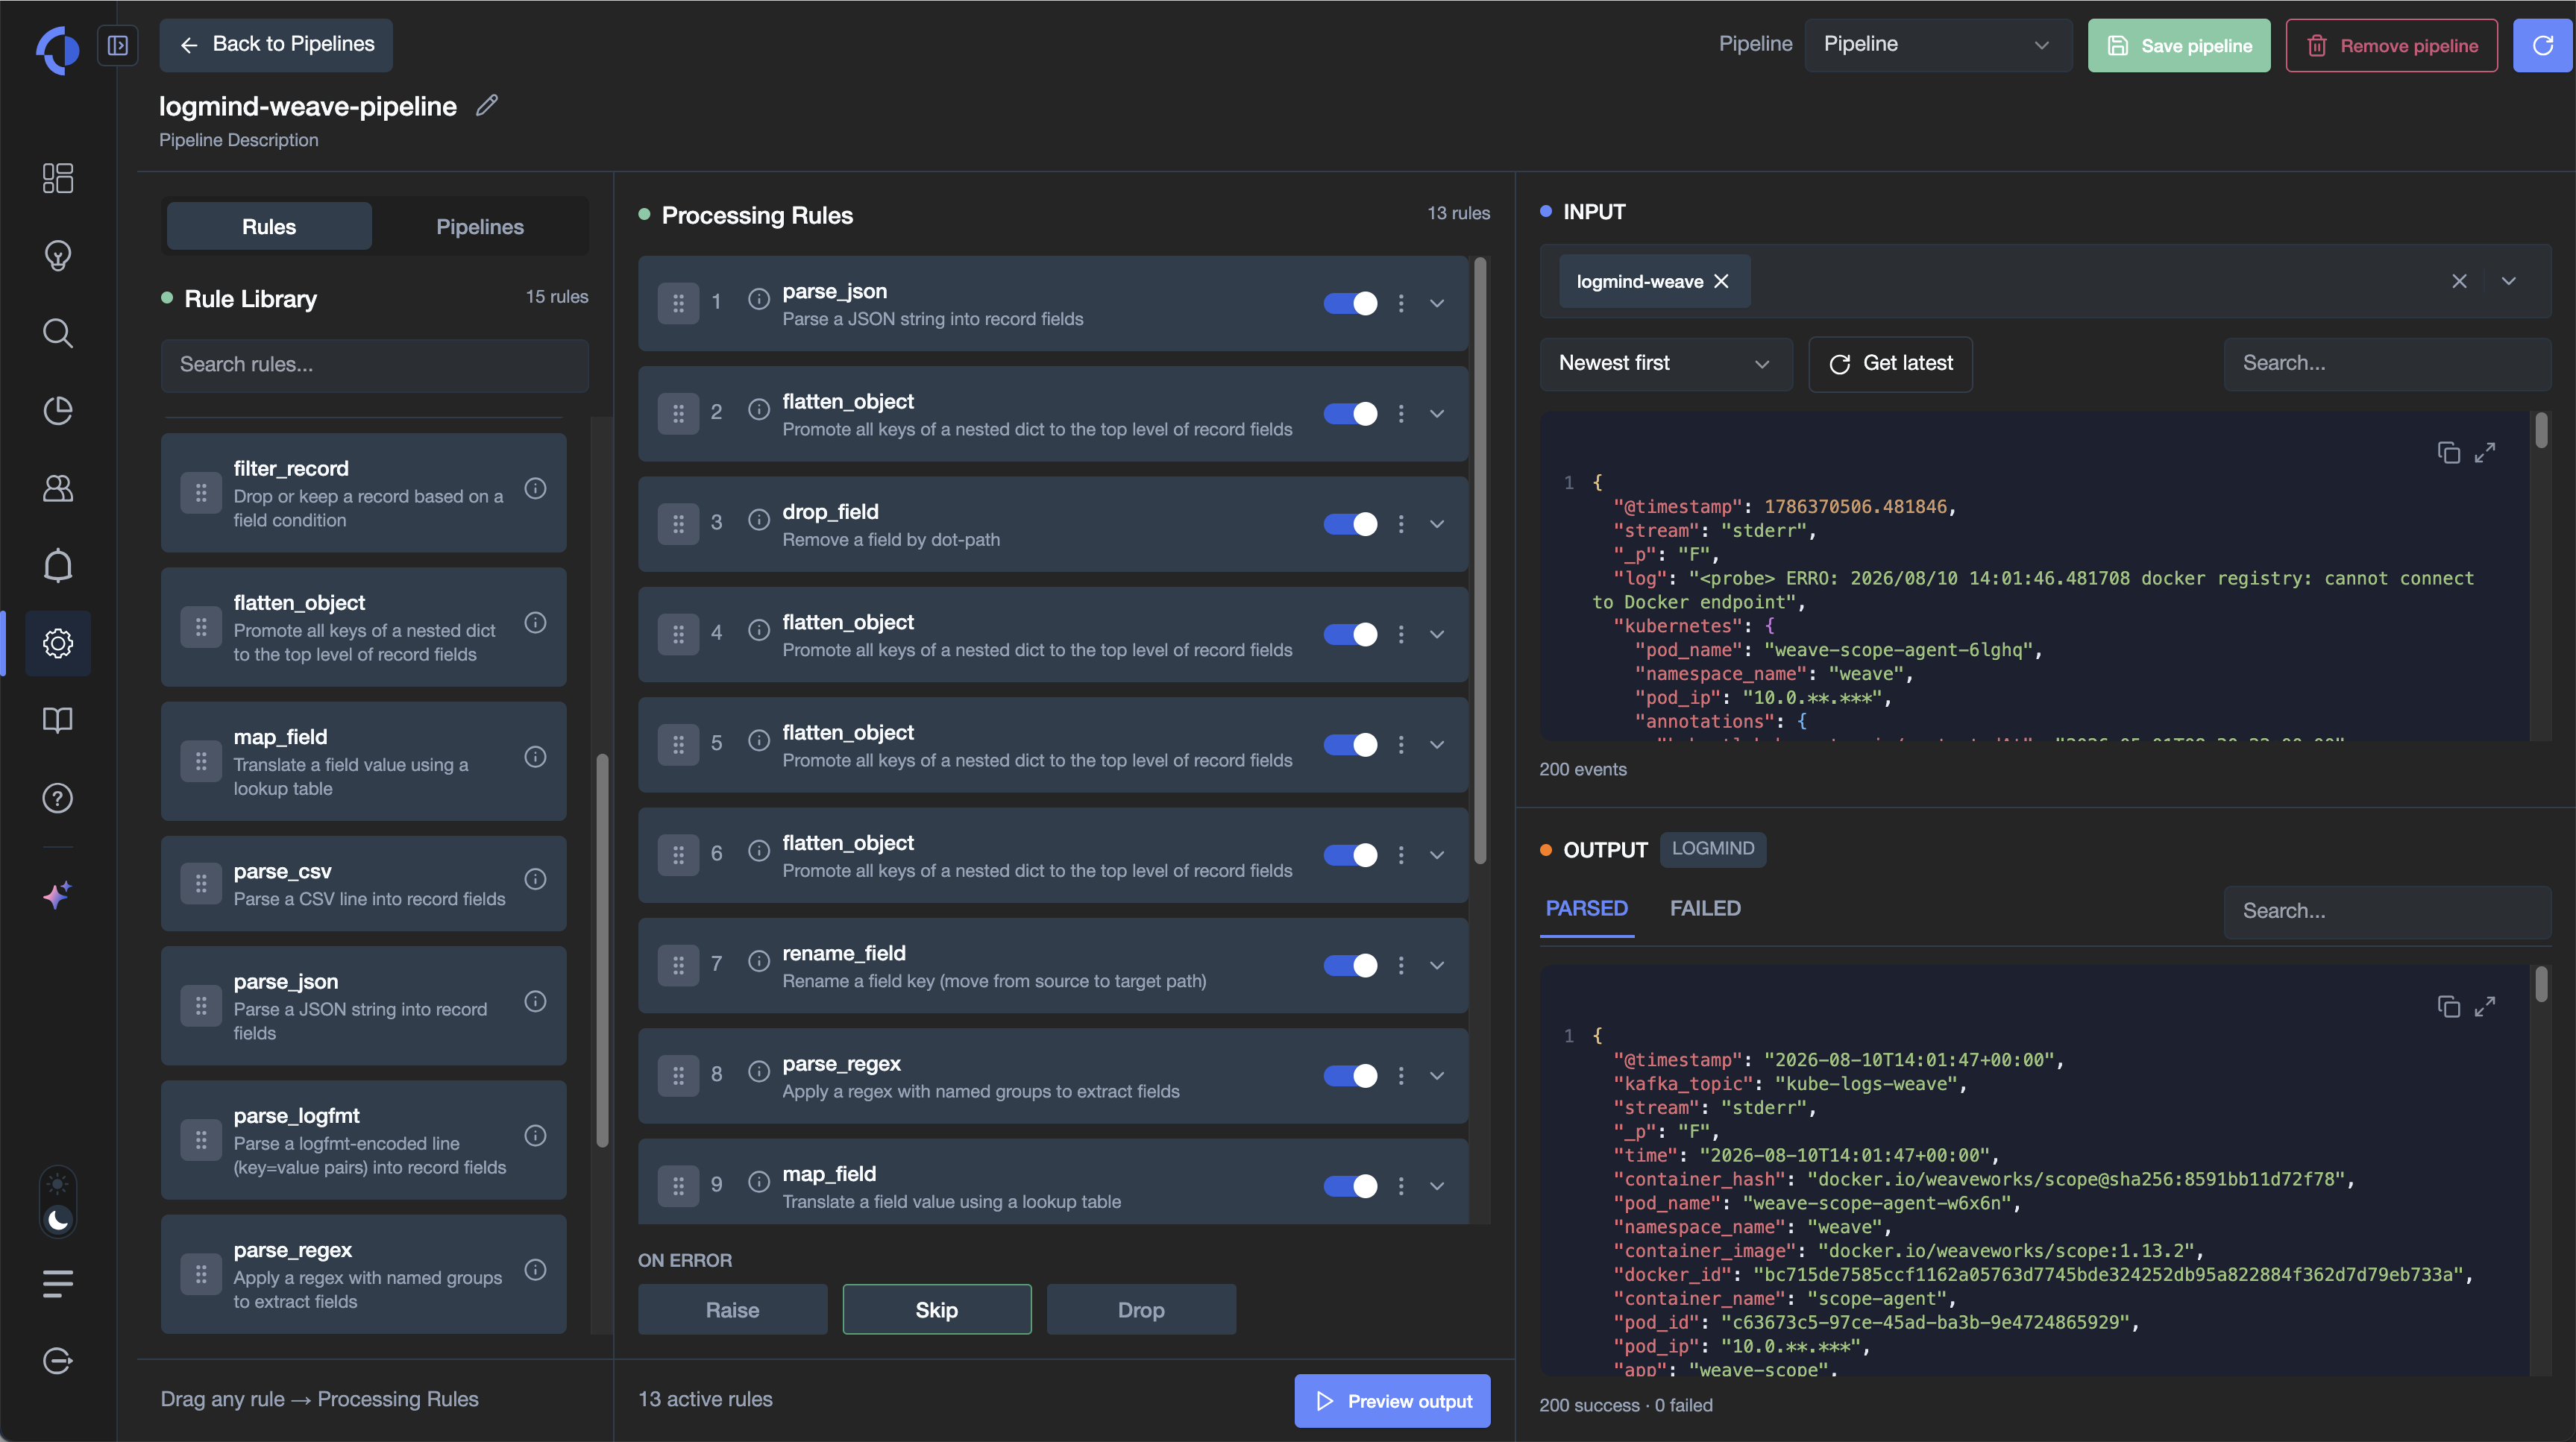
Reliable analysis begins with well-structured data. Logmind v3 introduces a visual workspace for building and managing the pipelines that prepare incoming events.
Teams can use reusable rules to parse, filter, map, extract, rename, flatten, or remove fields. Rules can be arranged into a processing sequence and enabled or disabled as requirements change.
The workspace displays raw input, processing steps, and parsed output together. Users can preview the result before saving a pipeline, search within the output, identify failed events, and define how processing errors should be handled.
This makes processing logic easier to build, test, review, and maintain. It also helps teams verify that incoming events are correctly structured before those events are used for monitoring, investigation, and analysis.
One connected operational workflow
Logmind v3 connects the full operational journey:
- Visual pipelines prepare incoming events for reliable analysis.
- The Operations Overview shows where attention is needed.
- Insights connect anomalies with affected services, entities, and dependencies.
- Modu explains available evidence and supports troubleshooting.
- Discovery exposes the events and patterns behind an issue.
- Dashboards make operational changes easier to monitor and communicate.
The result is less time spent navigating disconnected data and more time focused on the issues that affect services and users.
Logmind v3 is available now. Book a demo to explore the new experience and see how Logmind can help your team move from operational data to action.